DataEditR is an R package built on shiny and rhandsontable that makes it easy to interactively view, enter, filter and edit data. In this vignette we will explore some of the key features that are available through the data_edit() function.
In order to get started with DataEditR, we will need to install the package from CRAN and load it into our current R session:
install.packages("DataEditR")
library(DataEditR)
If you would like to use the development version of DataEditR it can be installed directly from GitHub:
devtools::install_github("DillonHammill/DataEditR")
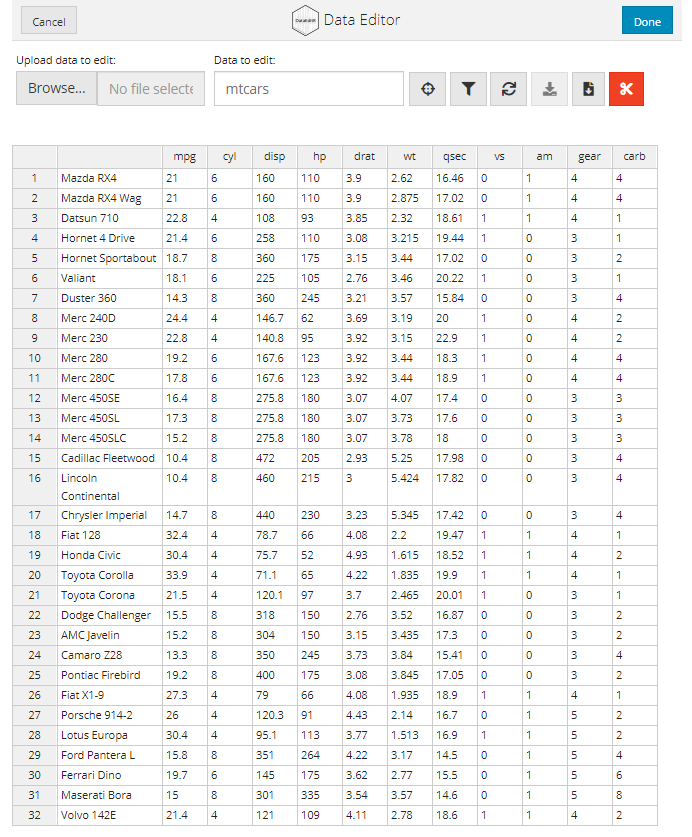
Simply supply your data in the form of a matrix, data.frame or data.table to data_edit() to view it in an interactive table. For example, if we wanted to take a look at the mtcars dataset:
data_edit(mtcars)

The data editor will open in an RStudio "dialog" box by default, but can be optionally displayed in the RStudio viewer pane or a web browser by setting viewer to "viewer" or "browser" respectively.
data_edit(mtcars,
          viewer = "browser")
The data editor will automatically move row names inside the table so that the row indices can be displayed on the left hand side to aid navigation. Once you are finished exploring the data, you can close the data editor by hitting the Done button in the top right corner. If you wish to cancel all changes made to the data, you can select the Cancel button in the top left corner and the unedited data will be returned.
data_edit() uses the dataInput module to read in any form of tabular data from file for viewing and editing. By default data_edit() will use read.csv from the utils package to read in files, but this can be changed to any reading function by supplying the name of the function to the read_fun argument. If you need to pass any additional arguments to your reading function, these can be supplied as a named list to the read_args argument.
mtcars <- data_edit("mtcars.csv",
                    read_fun = "read.csv",
                    read_args = list(header = TRUE))
head(mtcars)
#>                    mpg cyl disp  hp drat    wt  qsec vs am gear carb
#> Mazda RX4         21.0   6  160 110 3.90 2.620 16.46  0  1    4    4
#> Mazda RX4 Wag     21.0   6  160 110 3.90 2.875 17.02  0  1    4    4
#> Datsun 710        22.8   4  108  93 3.85 2.320 18.61  1  1    4    1
#> Hornet 4 Drive    21.4   6  258 110 3.08 3.215 19.44  1  0    3    1
#> Hornet Sportabout 18.7   8  360 175 3.15 3.440 17.02  0  0    3    2
#> Valiant           18.1   6  225 105 2.76 3.460 20.22  1  0    3    1
data_edit() uses the dataEdit module to provide a variety of interactive data manipulation tools to edit your data. We will explore the use of each of these tools below:
Rows or columns can be added to the data from within the data editor by right clicking on a cell within the table. This will display a context menu with the options to add or remove rows or columns.
data_edit(mtcars)
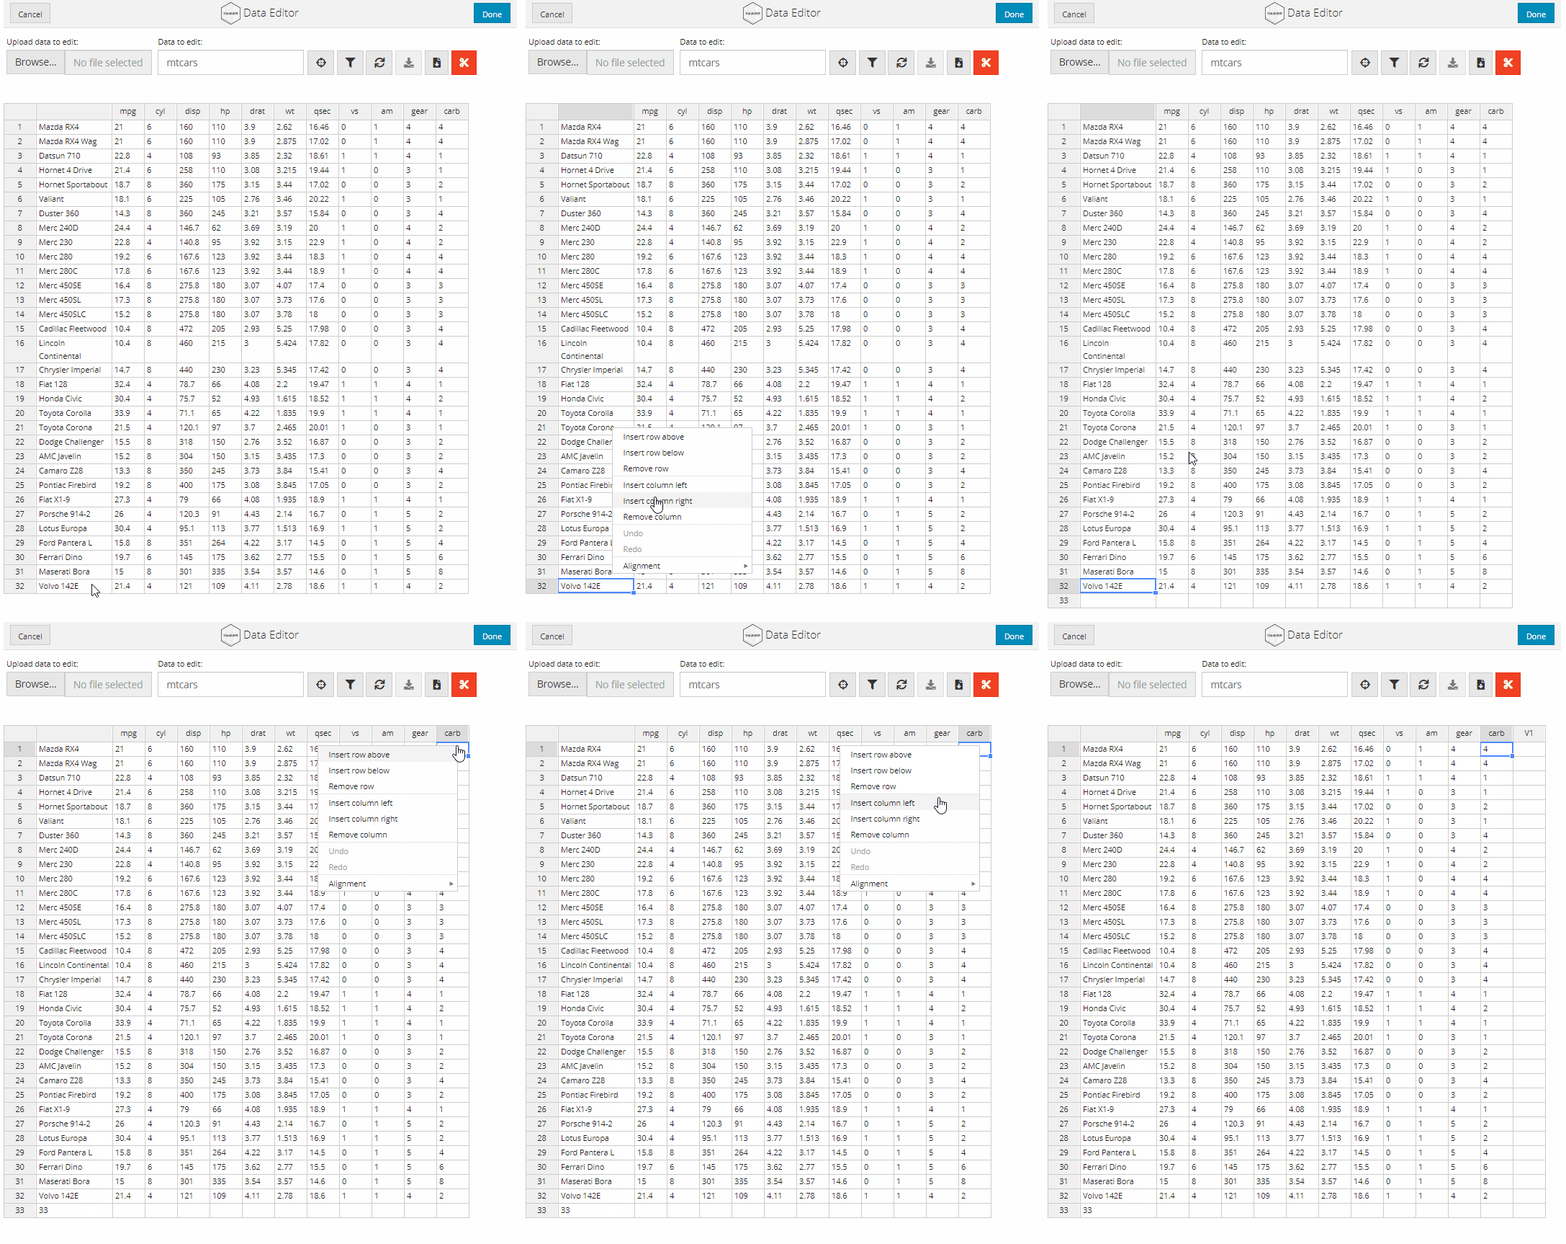
data_edit() has full support for editing row and column names. Simply select the cell that you want to edit and update its value within the table. As outlined above, the row names will appear within the table so that the row indices can be displayed on the left-hand side. The row indices cannot be edited. The new row or column names must be unique!
data_edit(mtcars)
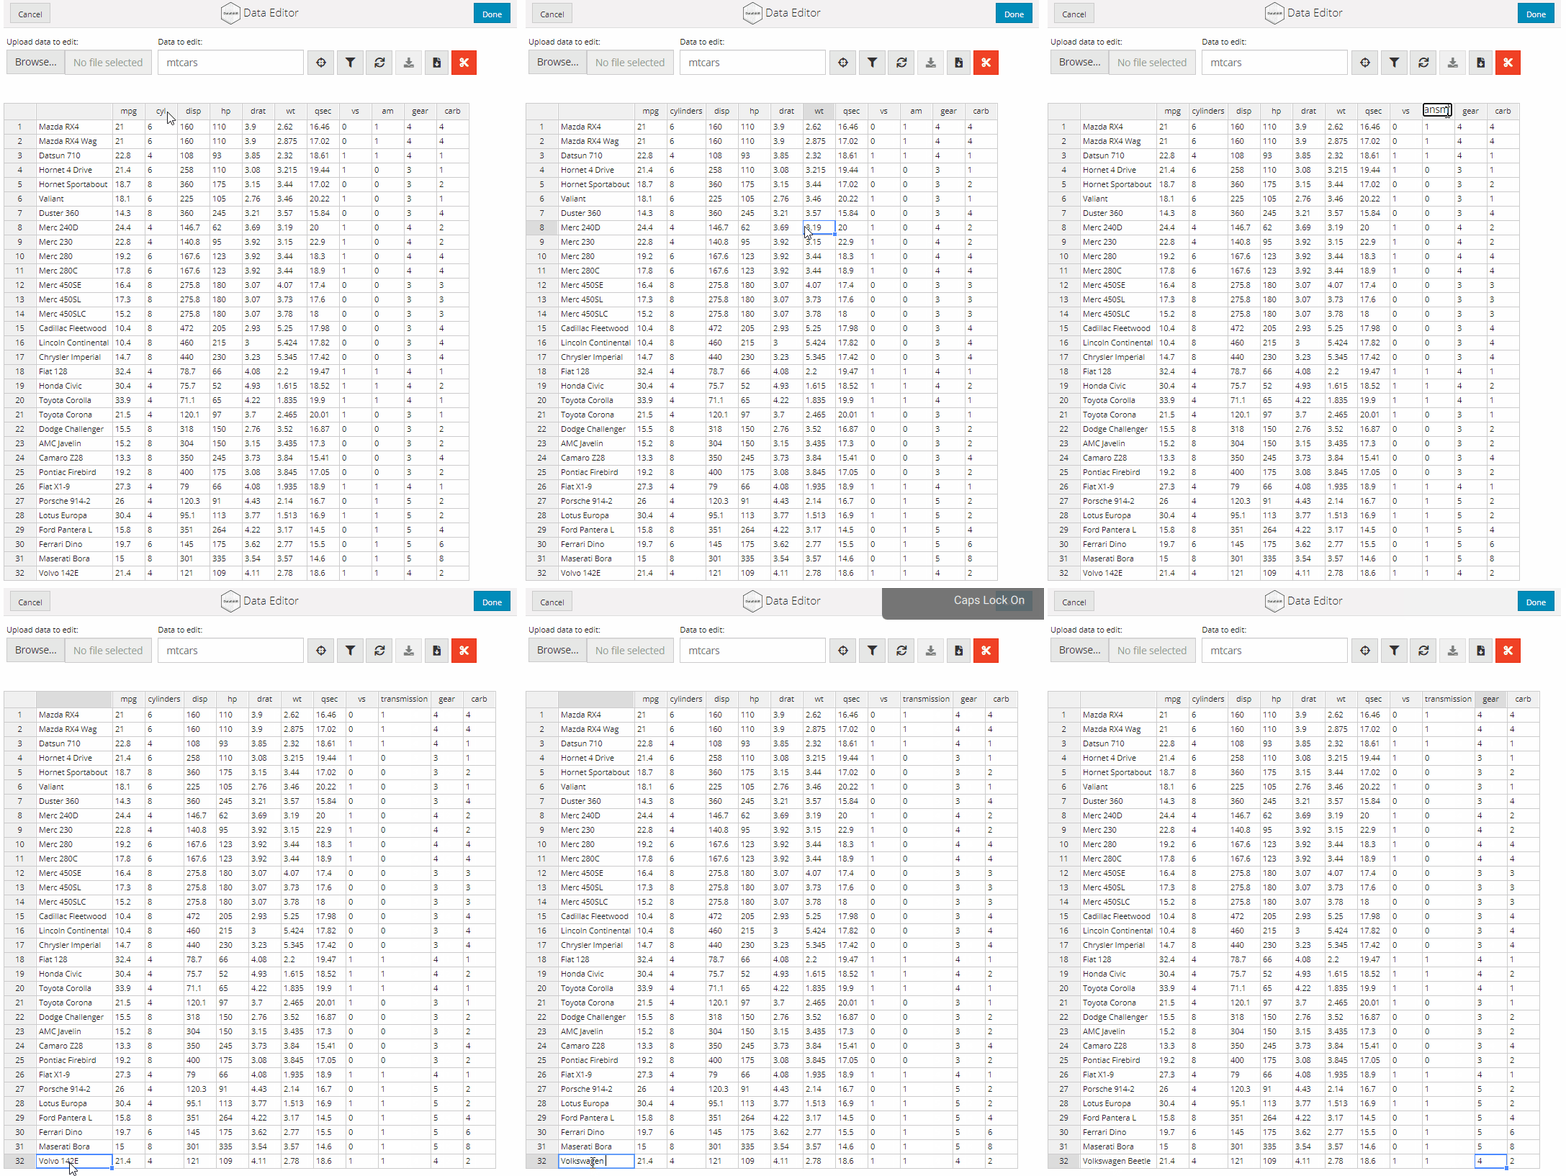
To prevent users from editing column names, set col_names = FALSE or supply the names of the columns that cannot be edited. For example, if we only wanted to prevent users from editing the name of the mpg column:
data_edit(mtcars,
          col_names = "mpg")
To size columns, go to the right-hand border of the cell containing the name of that column and drag the cursor to the desired width.
data_edit(mtcars)
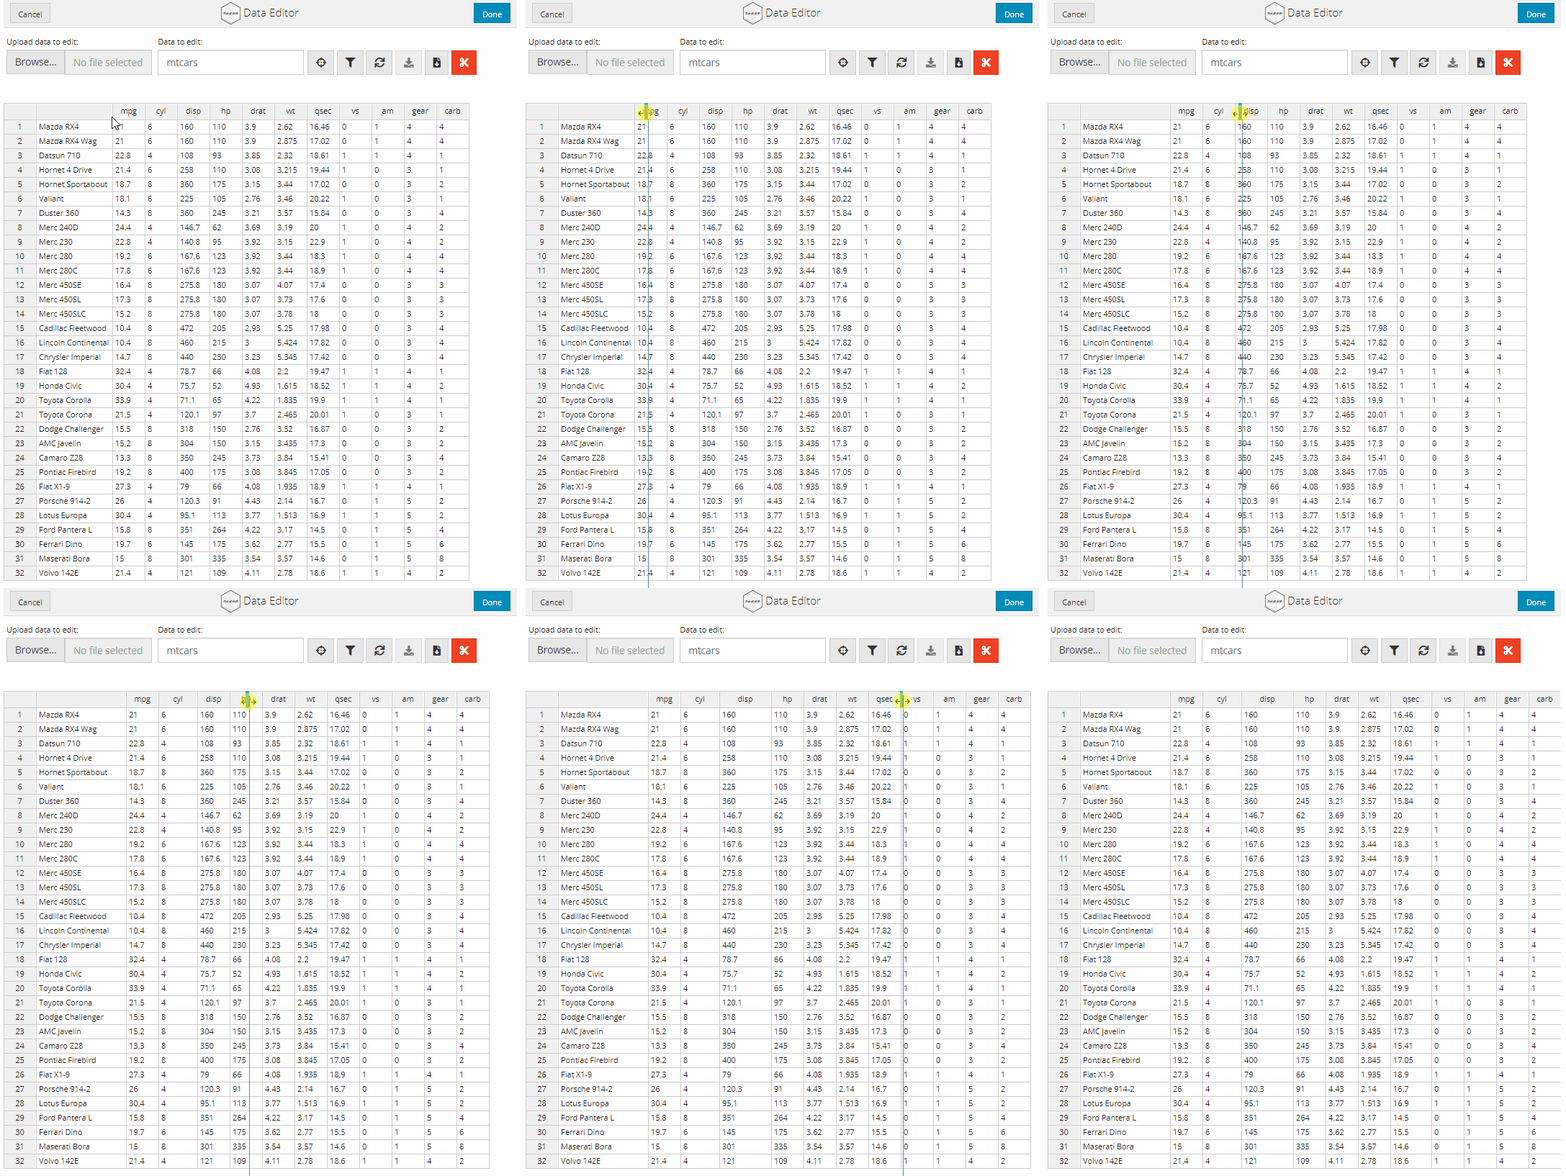
Values in cells can be dragged to other cells by selecting the filled cells and dragging the box in the lower right hand corner.
data_edit(mtcars)
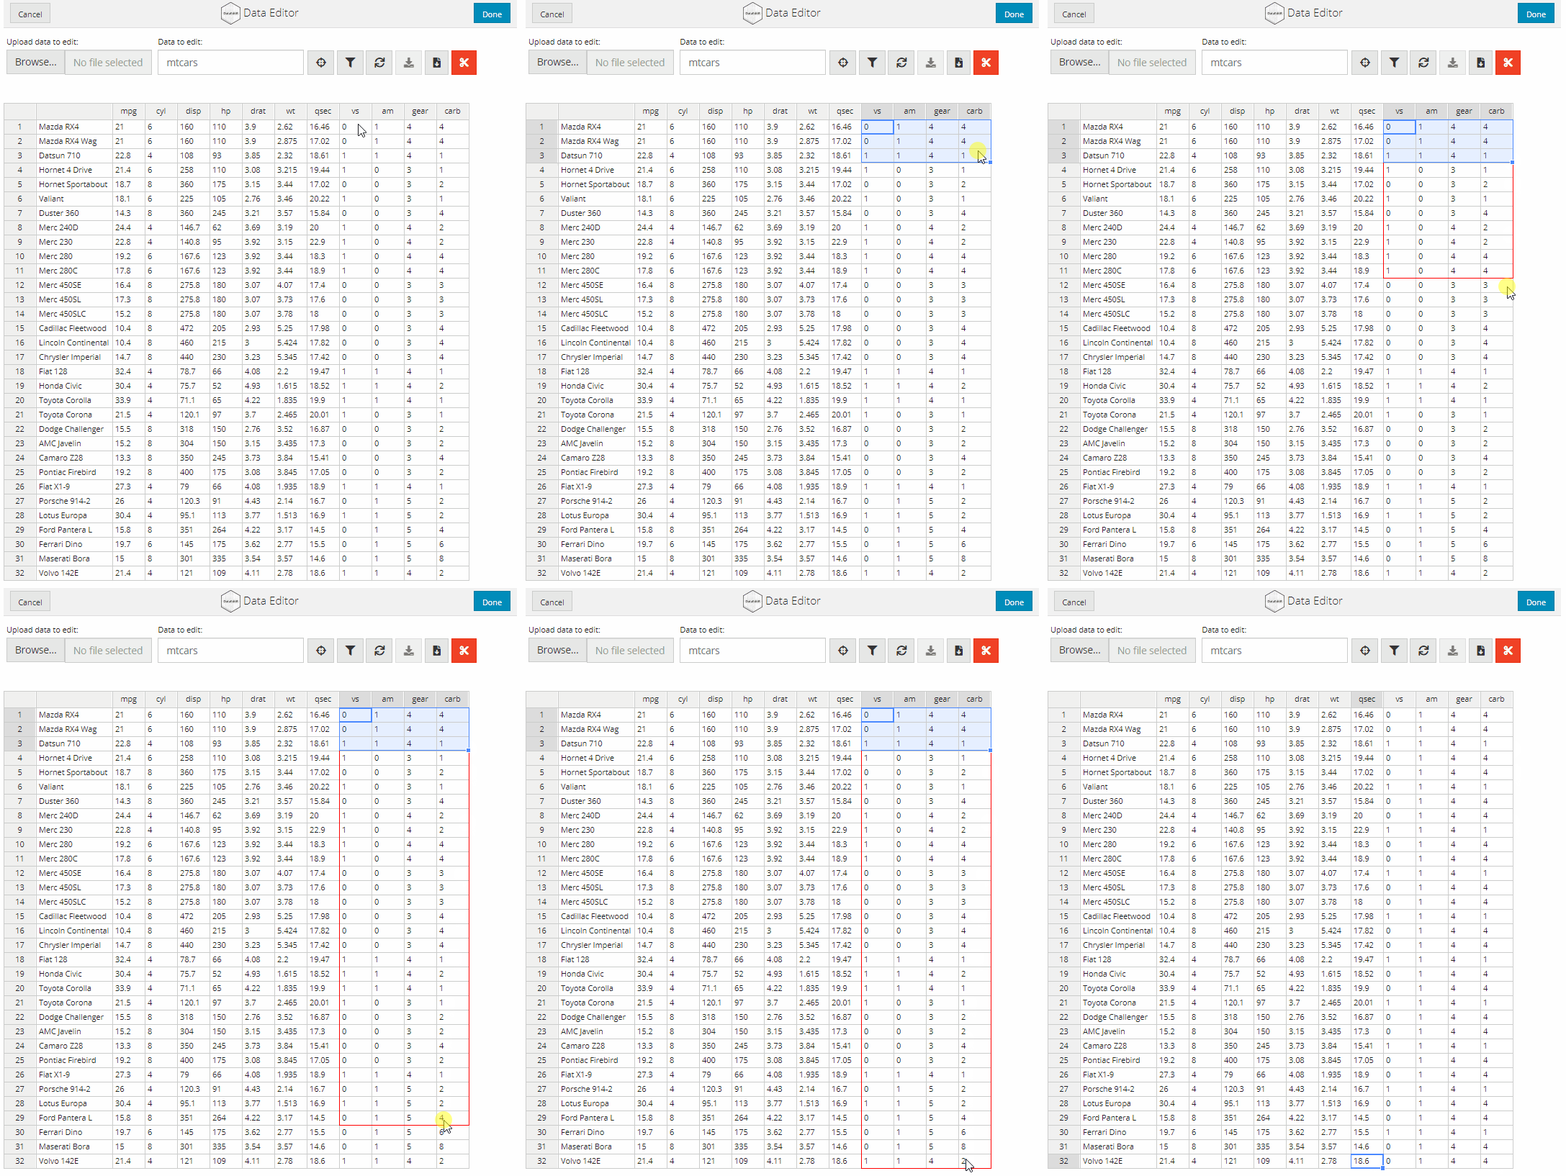
data_edit() can perform rbind and cbind operations internally to append new rows or columns to the data prior to editing. The new rows or columns should be supplied as a matrix or data.frame to the row_bind or col_bind arguments. If binding both rows and columns, it is important to note that rows are bound before columns.
# New column to add
new_col <- matrix(rep(NA, nrow(mtcars)),
                  ncol = 1,
                  dimnames = list(NULL, "test"))

# Edit data with new column added
data_edit(mtcars,
          col_bind = new_col)
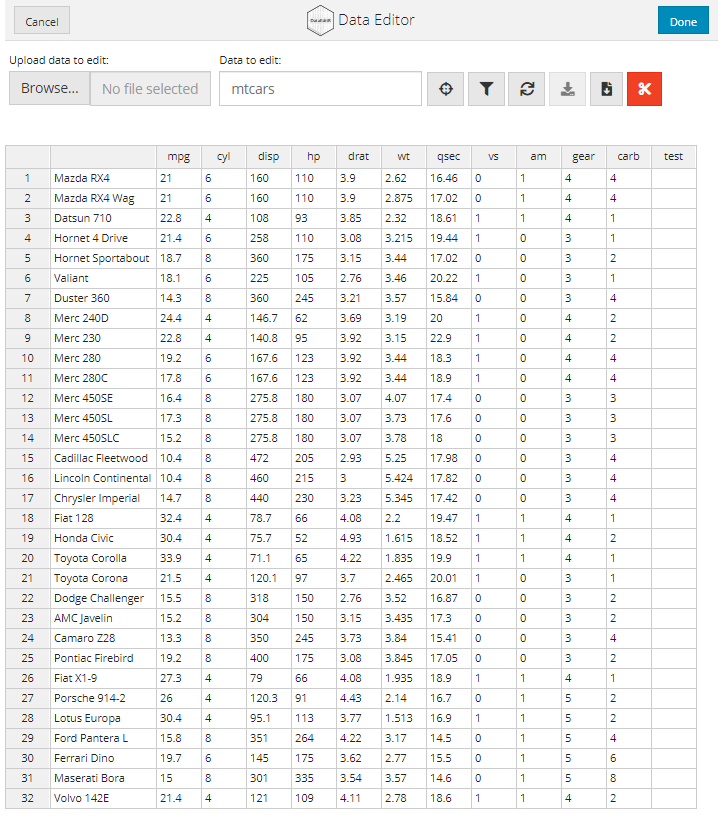
If you would like to prevent values from being edited in certain columns, you can supply the names of the columns that cannot be edited to the col_readonly argument. Users will be able to edit values and the column name, but these will be reverted to the original values. For example, if we wanted to prevent the mpg column from being edited:
data_edit(mtcars,
          col_readonly = "mpg")
You can also use data_edit() to interactively create data.frames from scratch without any coding.
If no data is supplied to data_edit() an empty data.frame will be constructed with 10 rows and columns. You can then build your data.frame from scratch by adding new rows and columns and annotating the cells.
data_edit()
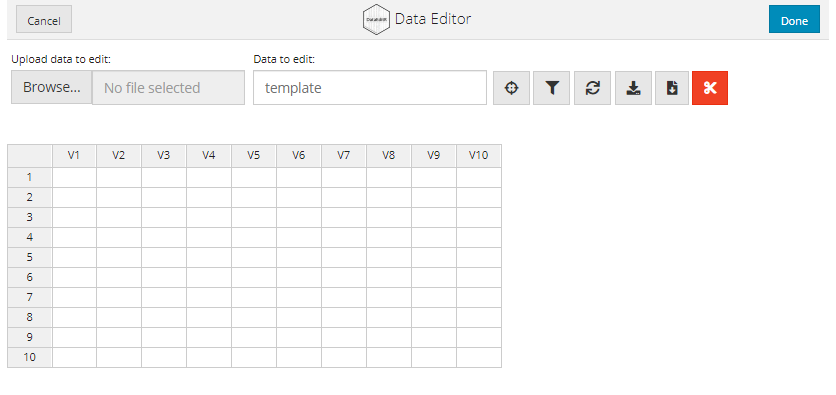
The dimensions of the template can be controlled by supplying a vector of the form c(nrow, ncol) to indicate the number of rows and columns to use.
data_edit(c(20, 15))
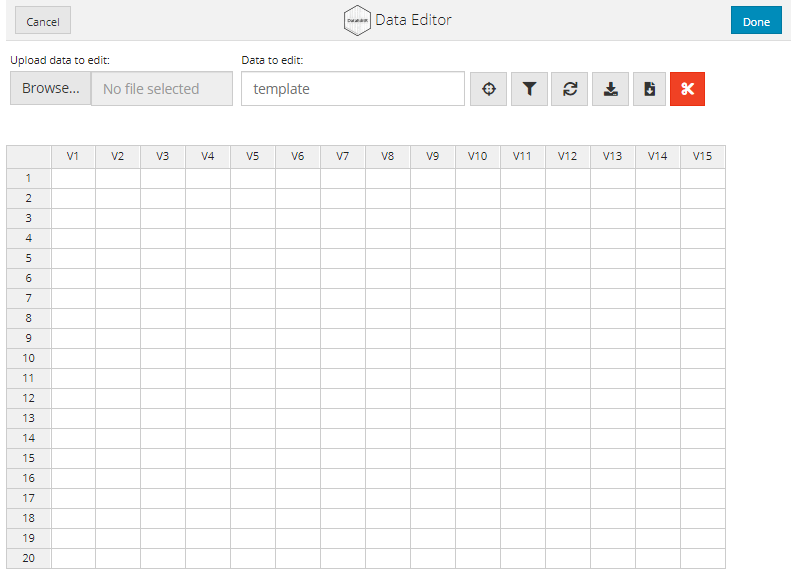
Alternatively, you can pass a vector of column names to create a data.frame template with pre-defined column names.
data_edit(c("Date", "Country", "Temperature", "Rainfall", "Visibility", "Humidity"))

data_edit() provides useful interfaces for selecting columns and filtering rows in your dataset. This makes it easy to export and edit subsets of a dataset or display a portion of the data for editing.
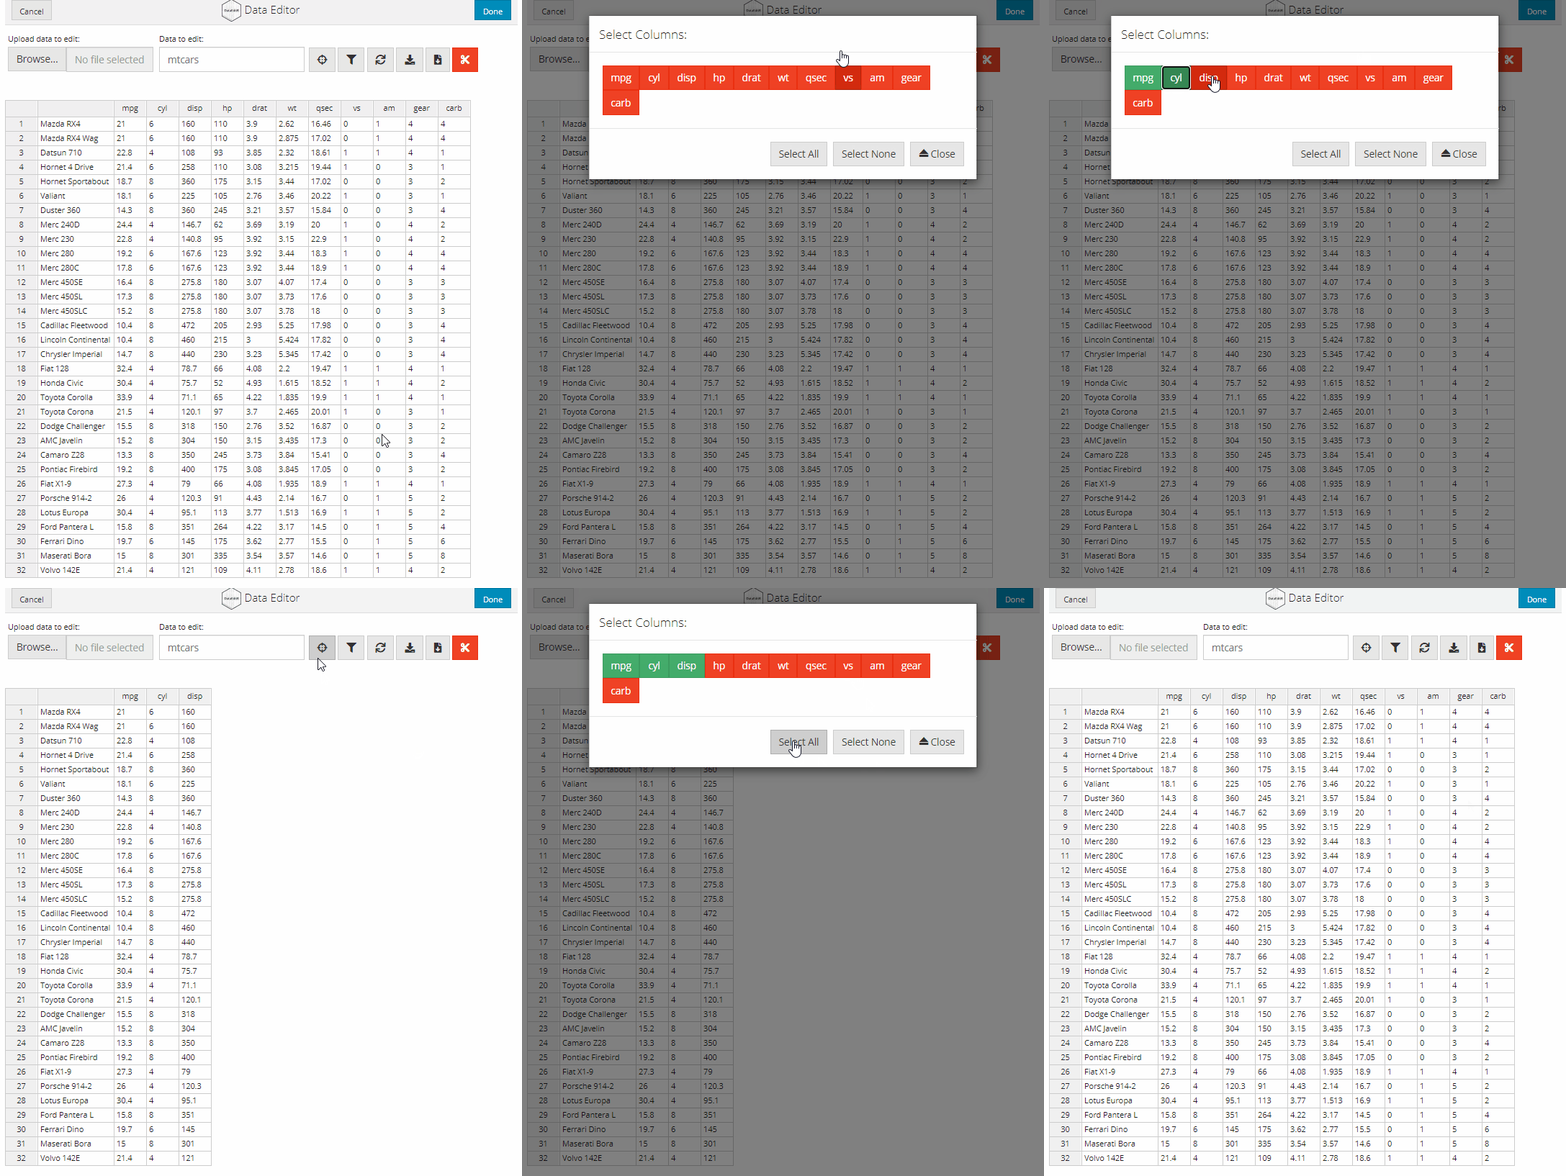
Column selection is supported through the dataSelect module which can be invoked by selecting the crosshairs icon. A pop-up window will open with a series of red buttons labelled with the names of the columns in the dataset. Simply click the buttons for the columns that you want to keep and close the window when you are done. The subsetted data will be displayed in the data editor for editing. The column selection can be changed at any time by selecting the crosshairs icon, there are also additional buttons to optionally add or remove all columns.
data_edit(mtcars)
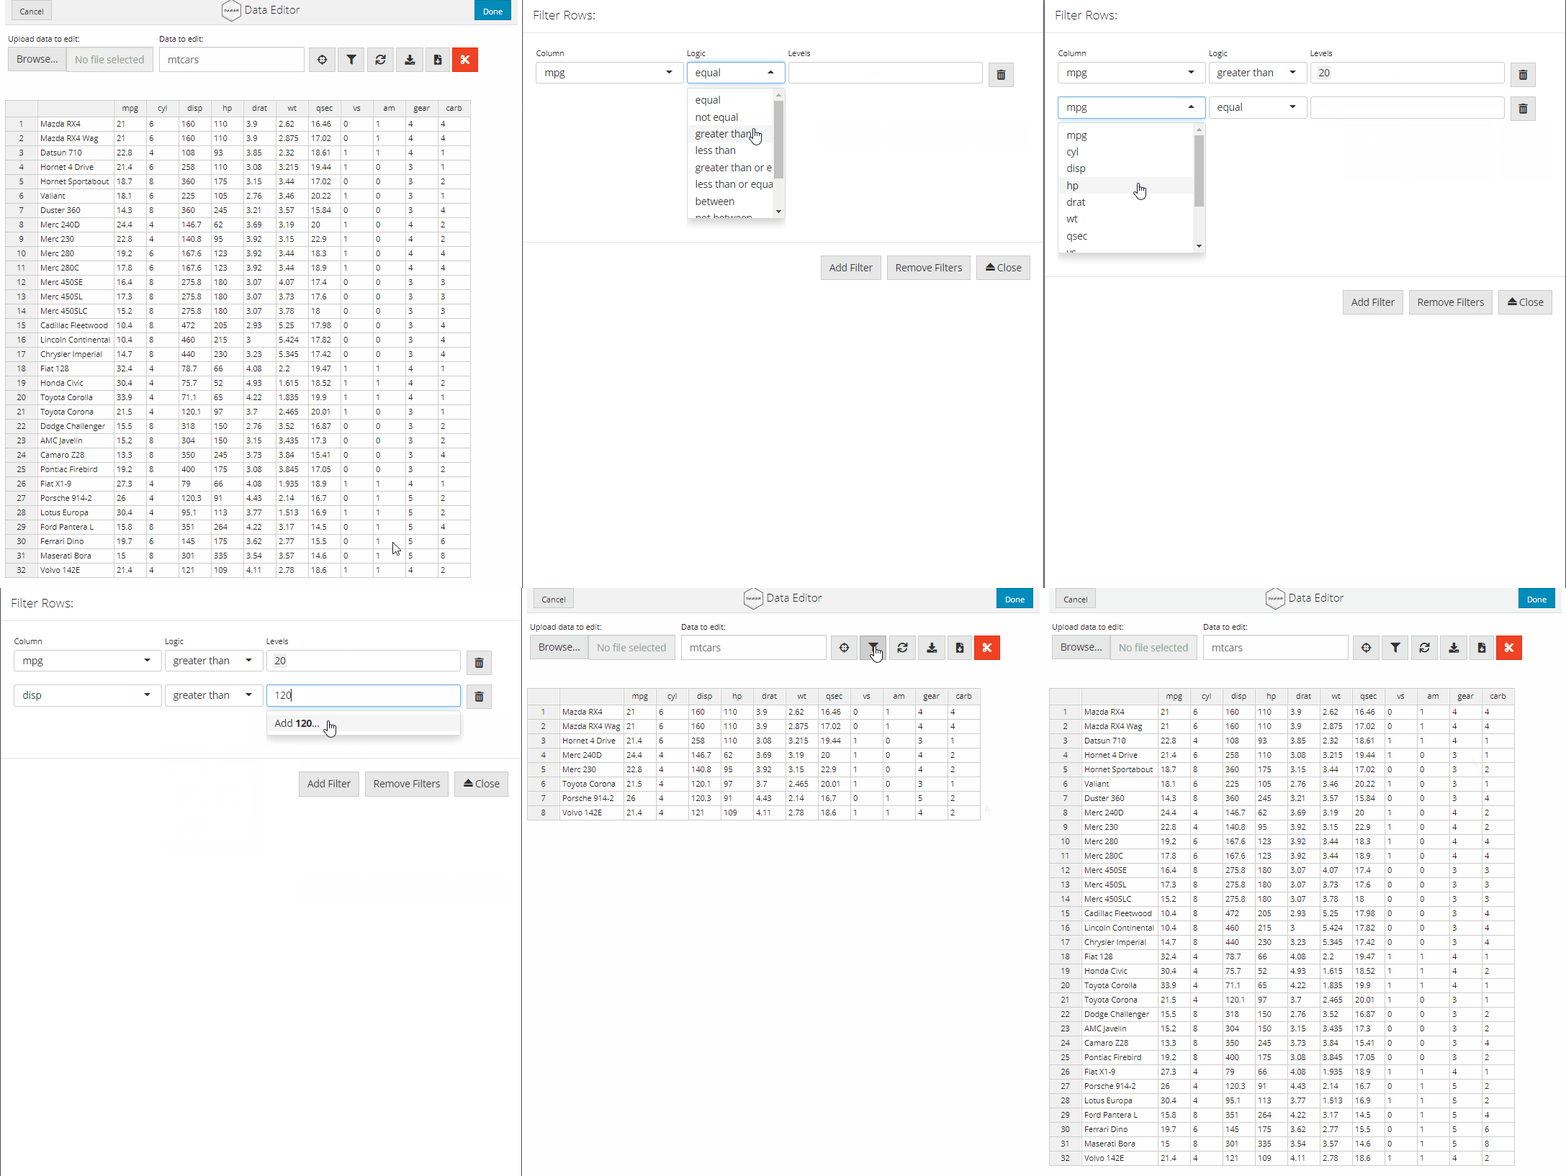
Row filtering is supported through the dataFilter module which can be invoked by selecting the filter icon. A pop-up window will open with a series of dropdown boxes. To add a filter, simply select the Add Filter button and indicate the column, logic and levels to filter the data. Individual filters can be deleted by selecting the trash icon next to the relevant filter. All filters can be removed by selecting the Remove Filters buttons. Once you have created all your filters, close the window and the filtered data will be displayed in the data editor for editing.
data_edit(mtcars)
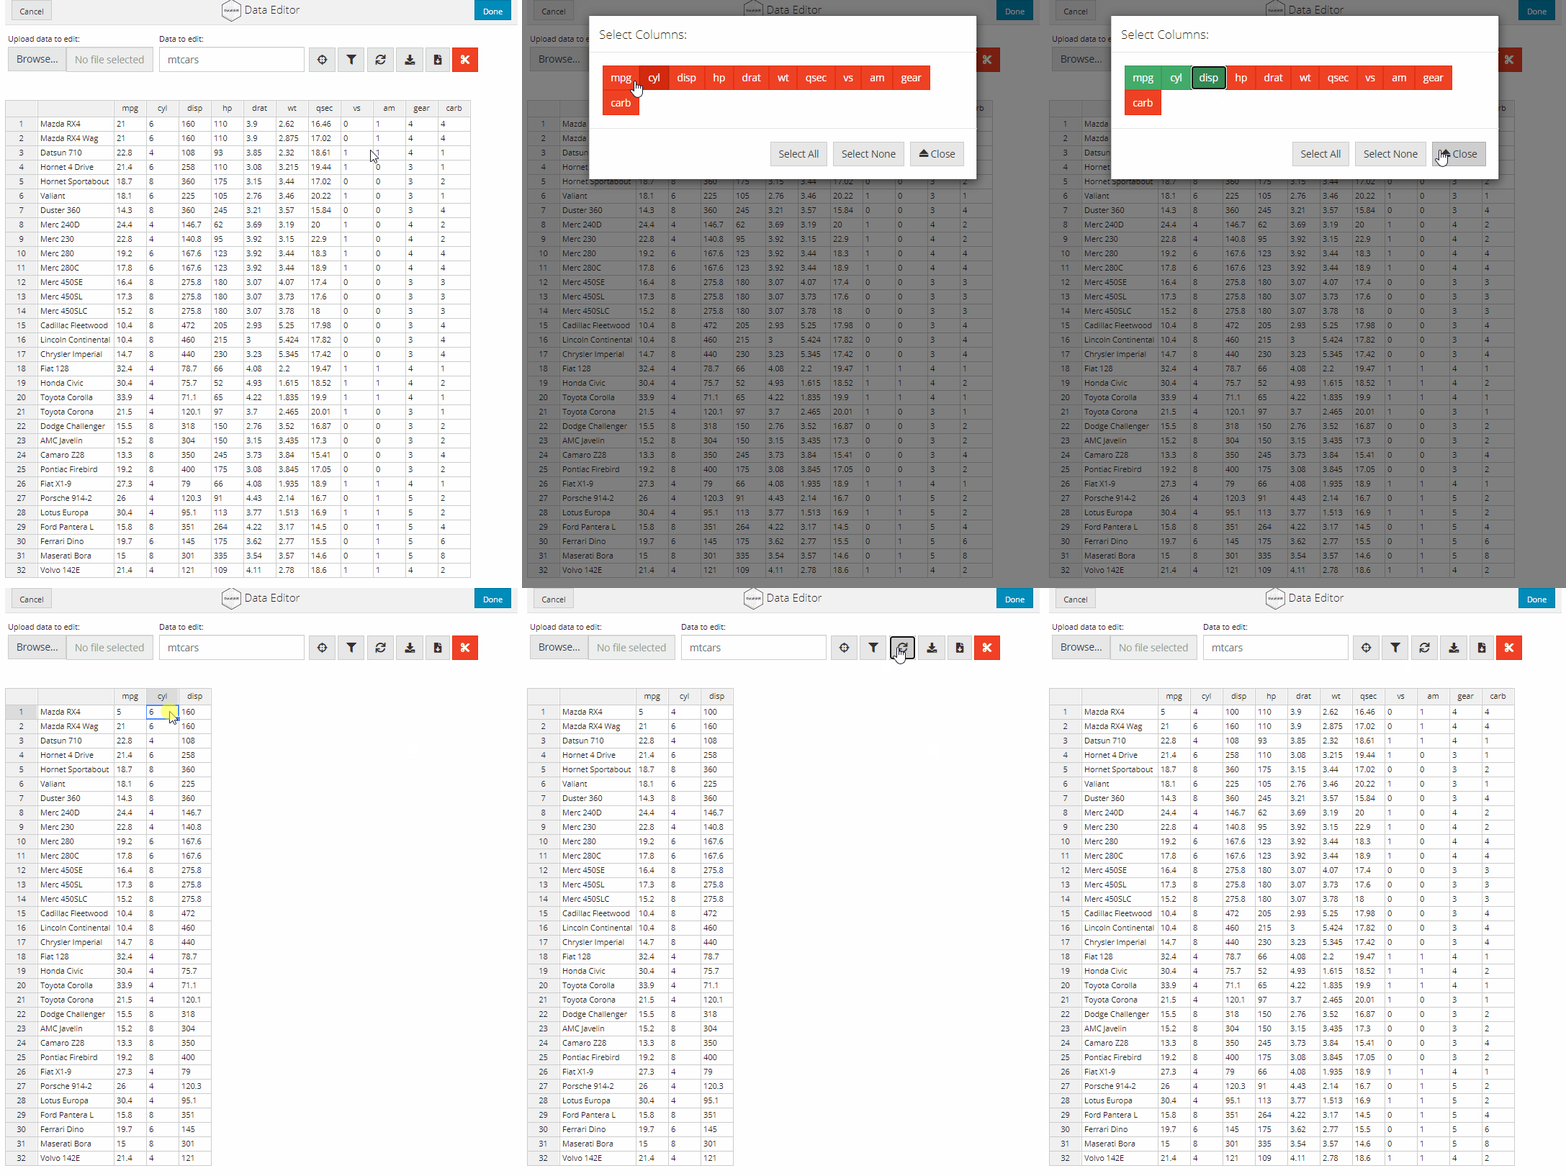
Changes made to data subsets are not automatically synchronised in the complete dataset to allow for increased flexibility. However, it is possible to synchronise these changes by selecting the sync button. Currently, synchronising data subsets with altered row/column numbers is not supported.
data_edit(mtcars)
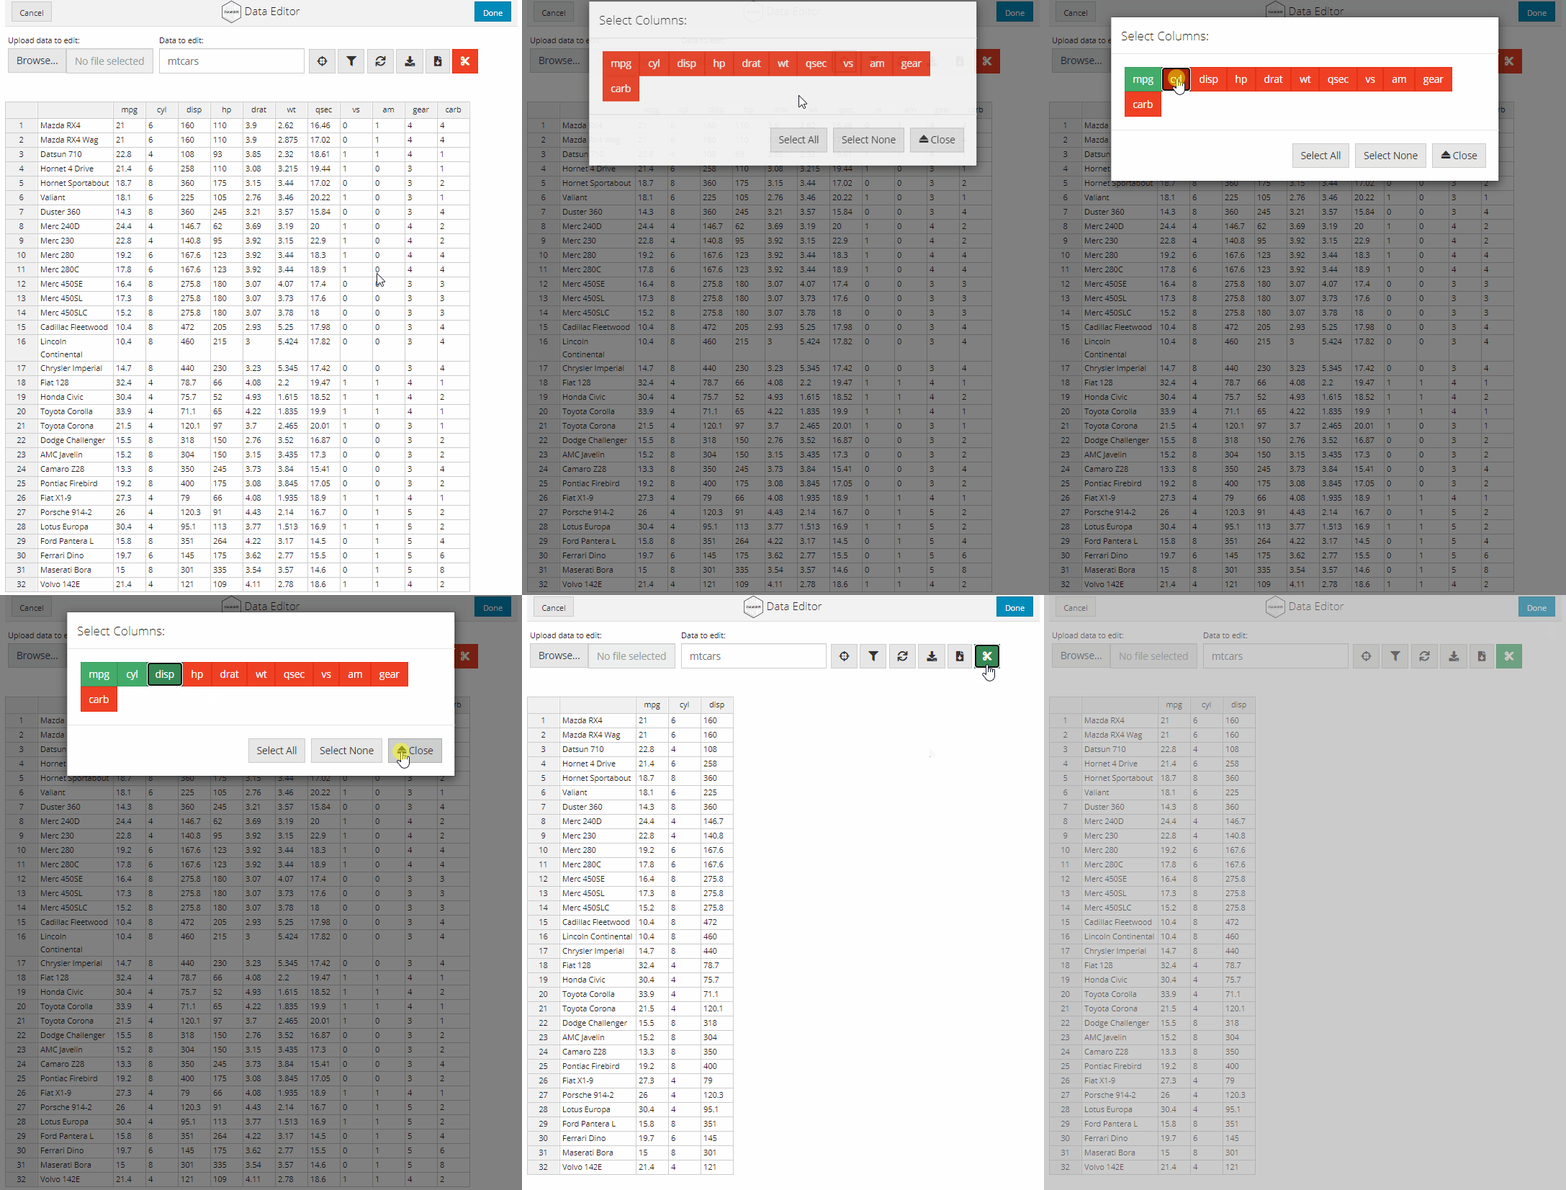
data_edit() will return the complete dataset as a R object for downstream use by default. However, you can select the scissors icon if you would like to return just the subset of the data that you are working on.
mtcars_subset <- data_edit(mtcars)
str(mtcars_subset)
data_edit() will automatically return the edited data with appropriate column classes as an R object for use within R. Character columns are not converted to factors by default, but this can be changed by setting col_factor = TRUE.
# Add character column
mtcars_new <- cbind(rownames(mtcars), mtcars)
colnames(mtcars_new) <- "car"

# Convert characters to factors
mtcars_new <- data_edit(mtcars_new,
                        col_factor = TRUE)
str(mtcars_new)
#> 'data.frame':    32 obs. of  12 variables:
#>  $ car : Factor w/ 32 levels "AMC Javelin",..: 18 19 5 13 14 31 7 21 20 22 ...
#>  $ mpg : num  21 21 22.8 21.4 18.7 18.1 14.3 24.4 22.8 19.2 ...
#>  $ cyl : num  6 6 4 6 8 6 8 4 4 6 ...
#>  $ disp: num  160 160 108 258 360 ...
#>  $ hp  : num  110 110 93 110 175 105 245 62 95 123 ...
#>  $ drat: num  3.9 3.9 3.85 3.08 3.15 2.76 3.21 3.69 3.92 3.92 ...
#>  $ wt  : num  2.62 2.88 2.32 3.21 3.44 ...
#>  $ qsec: num  16.5 17 18.6 19.4 17 ...
#>  $ vs  : num  0 0 1 1 0 1 0 1 1 1 ...
#>  $ am  : num  1 1 1 0 0 0 0 0 0 0 ...
#>  $ gear: num  4 4 4 3 3 3 3 4 4 4 ...
#>  $ carb: num  4 4 1 1 2 1 4 2 2 4 ...
The edited data can also be written to a file of any format by specifying the name of the file to the save_as argument and specifying the name of the writing function to use through write_fun. The default is to use write.csv from the utils package. You can also pass any additional arguments to your write function in a named list to write_args. The data will be written to file when the Done button is selected.
mtcars_new <- data_edit(mtcars,
                        save_as = "mtcars.csv",
                        write_fun = "write.table",
                        write_args = list(sep = ",",
                                          row.names = TRUE))
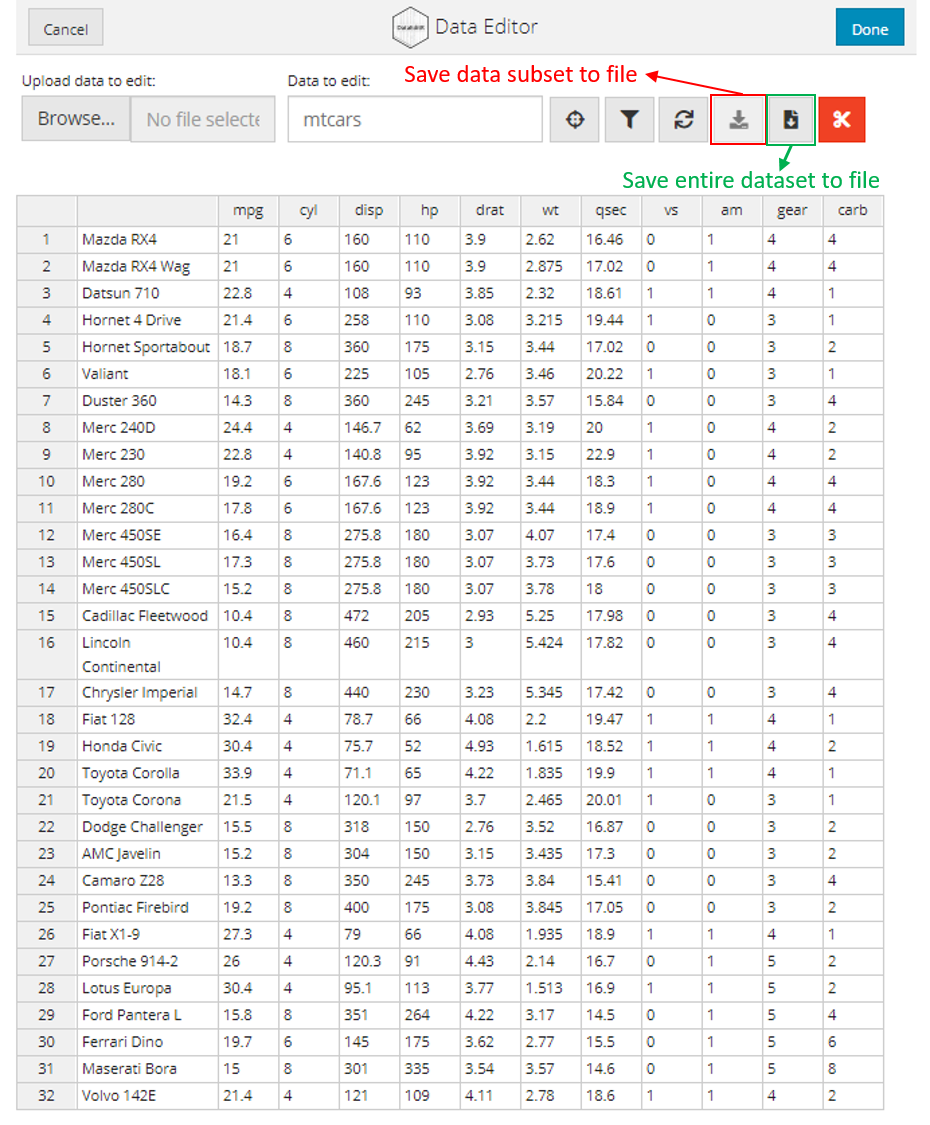
Alternatively, data can be saved to file by selecting either of the file download buttons as highlighted in the image below. The button of the left is used to save the data subset to file whilst the button on the right is used to save the entire dataset to file.
data_edit() can also be used to accept complex inputs from users and these inputs can be restricted by adding columns with checkboxes or dropdown menus. To use this feature, the options for the columns must be supplied in a named list through the col_options argument. It is important to note that should you choose to use this feature, users will be unable to add or remove columns as described previously.
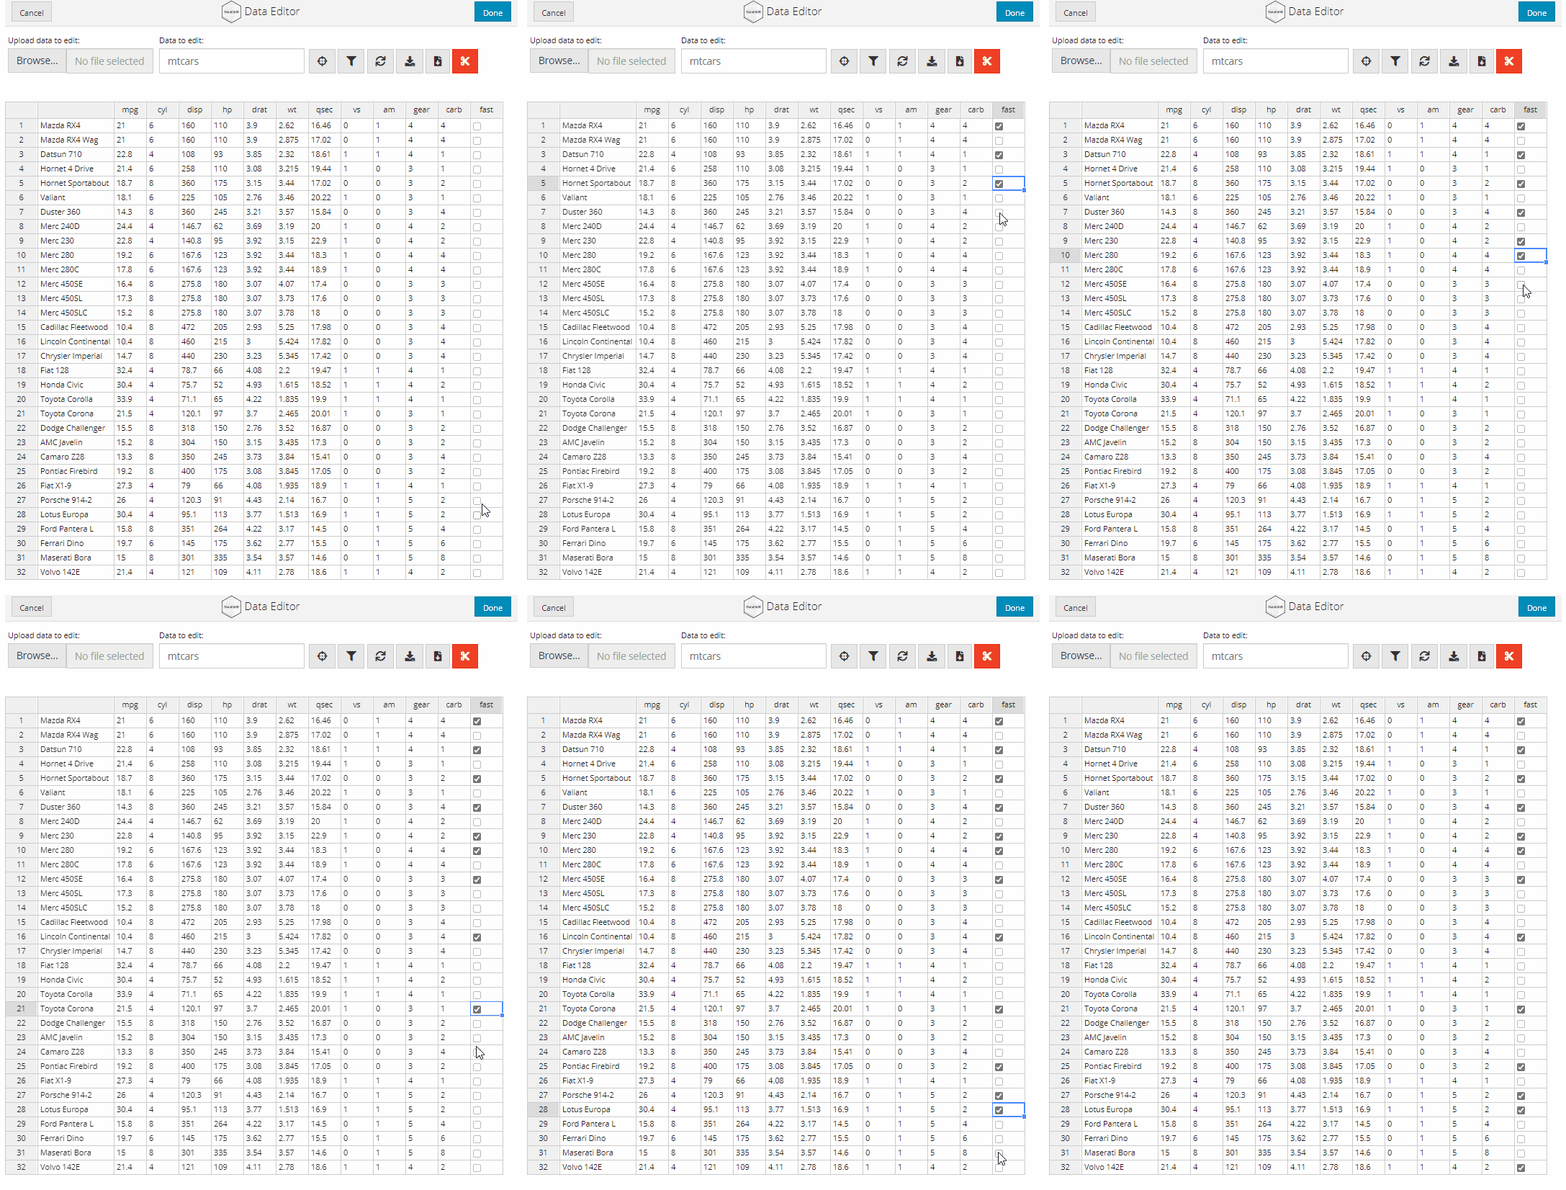
Checkboxes can be used to obtain TRUE or FALSE value inputs from users. The resulting data will have a value of TRUE or NA based on user input.
data_edit(mtcars,
          col_bind = "fast",
          col_options = list(fast = c(TRUE,FALSE)))
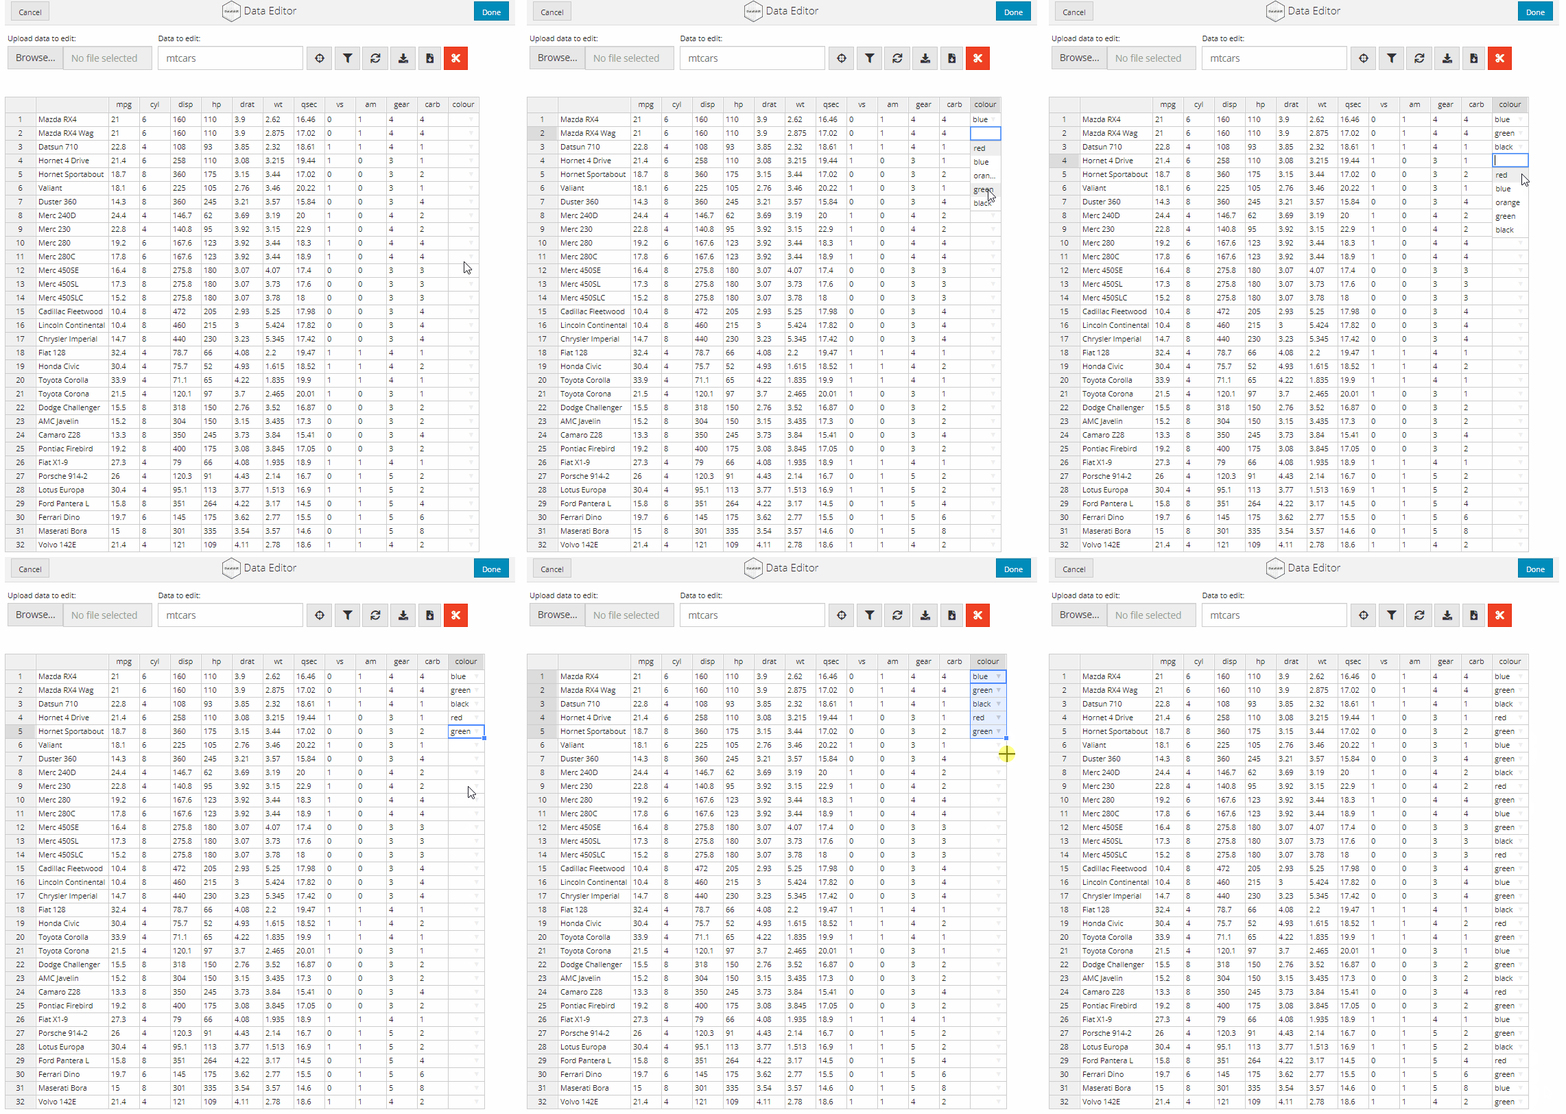
Dropdown menus can be used to help prevent typing errors when set number of options are available for a column. For example, if we have a factor with levels Treatment-A, Treatment-B or Treatment-C it would be easier to select these options from a dropdown menu instead of having to manually type them. Dropdown menus can be added in the same way as checkboxes.
# Add column for car colour
data_edit(mtcars,
          col_bind = "colour",
          col_options = list(colour = c("red",
                                        "blue",
                                        "orange",
                                        "green",
                                        "black")))
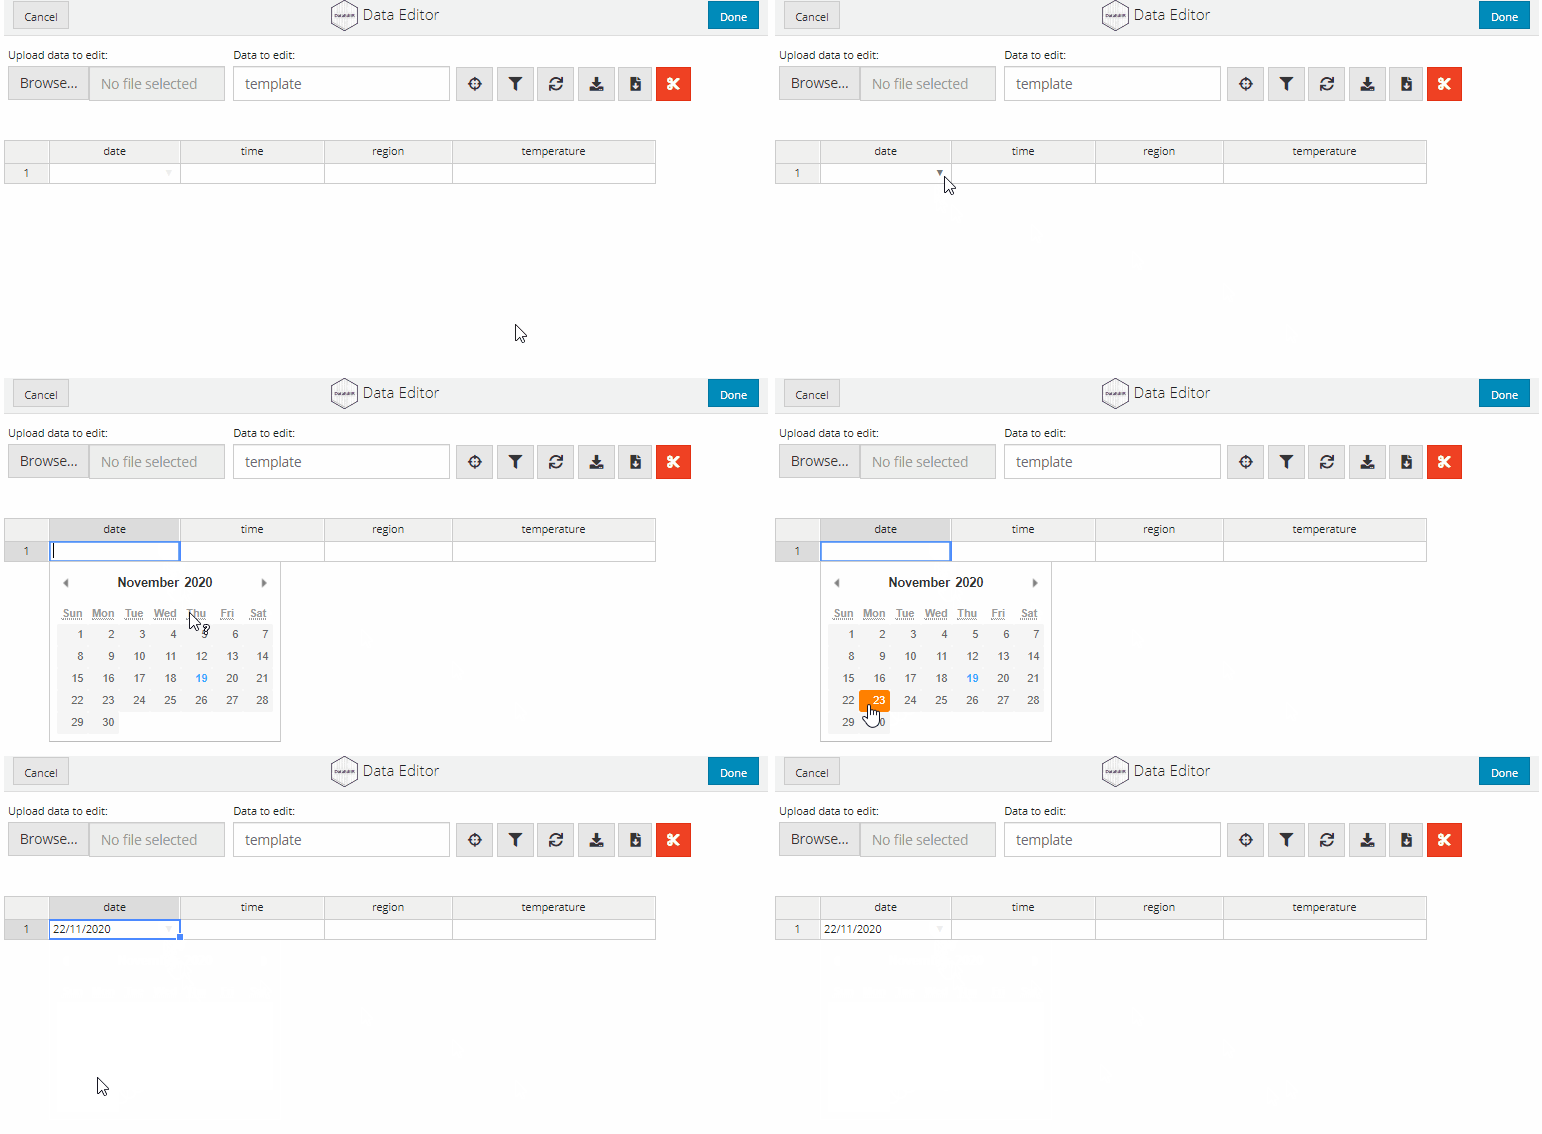
Dates can be entered interactively by selecting the relevant day from a calender. To convert a column to accept interactive date inputs, supply a list with the name of the column and "date" as the option to col_options.
data_edit(c("date", "time", "region", "temperature"),
          col_options = list(date = "date"))
If you would like to keep your data entries a secret, you convert relevant columns to accept passwords as inputs. The data is entered as per usual, but the input is displayed asterisks to conceal the entered data. To convert a column to accept password inputs, supply a list with the name of the column and "password" as the option to col_options.
data_edit(c("date", "time", "user", "password"),
          col_options = list(password = "password"))

data_edit() has been designed to be simple, but does come with some customisation options including column stretching, addition of logos and/or titles or custom themes.
If you would like to make full use of the space available to you, you can set col_stretch = TRUE to stretch the columns to fill the full width of the display.
data_edit(mtcars,
          col_stretch = TRUE)
data_edit() does also have support for adding a logo and/or title to the data editor. For example, if you wanted to use data_edit() within your own package you can customise it with your package logo and instructions to the user through title.
car_logo <- 'https://raw.githubusercontent.com/DillonHammill/DataEditR/master/vignettes/DataEditR/DataEditR-Car.png'
data_edit(mtcars,
          logo = car_logo,
          logo_size = 100,
          title = "mtcars")
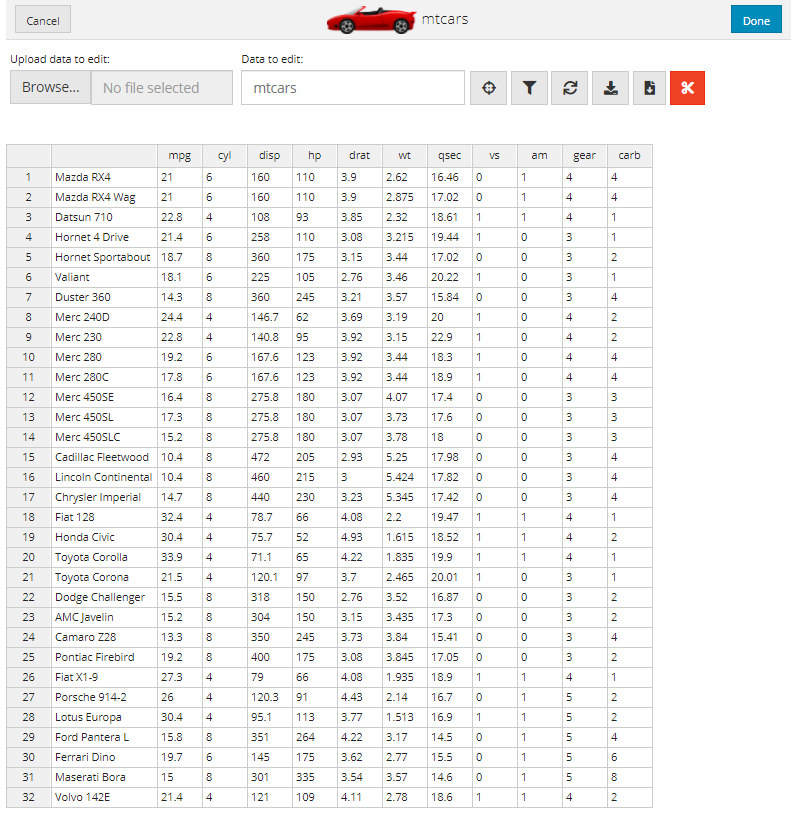
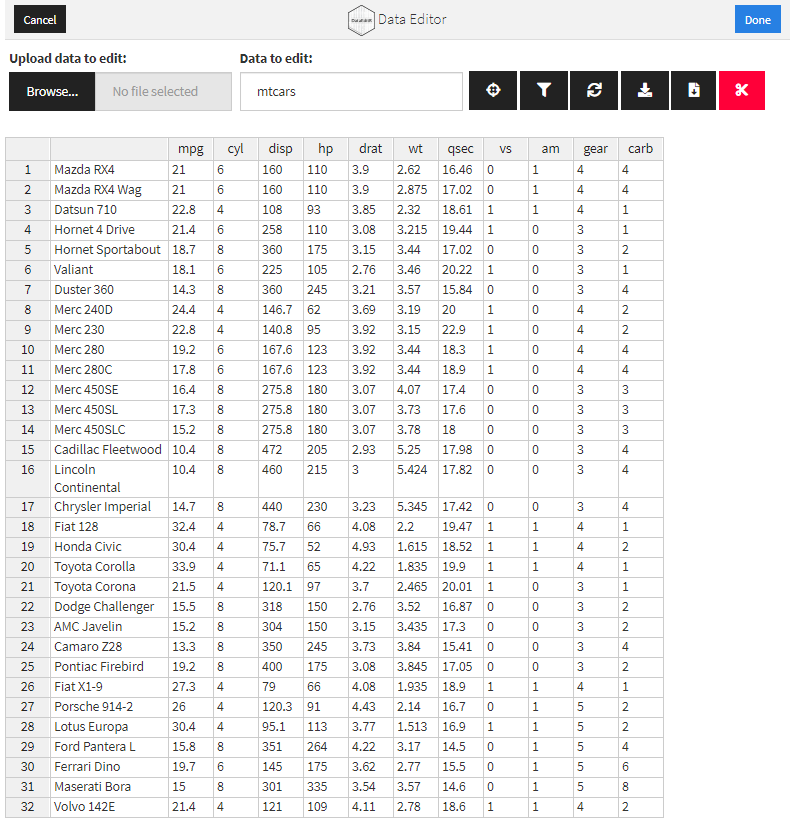
data_edit() makes use of the bslib package to customise the appearance of the data editor. You can explore the different themes by supplying the name of a preset bslib theme to the theme argument. Alternatively, you can create your own custom bs_theme and supply that object to theme instead.
# Preset theme
data_edit(mtcars,
          theme = "cosmo")

# Custom theme
library(bslib)
custom_theme <- bs_theme(
  version = 3,
  bootswatch = "cosmo"
)

data_edit(
  mtcars,
  theme = custom_theme
)
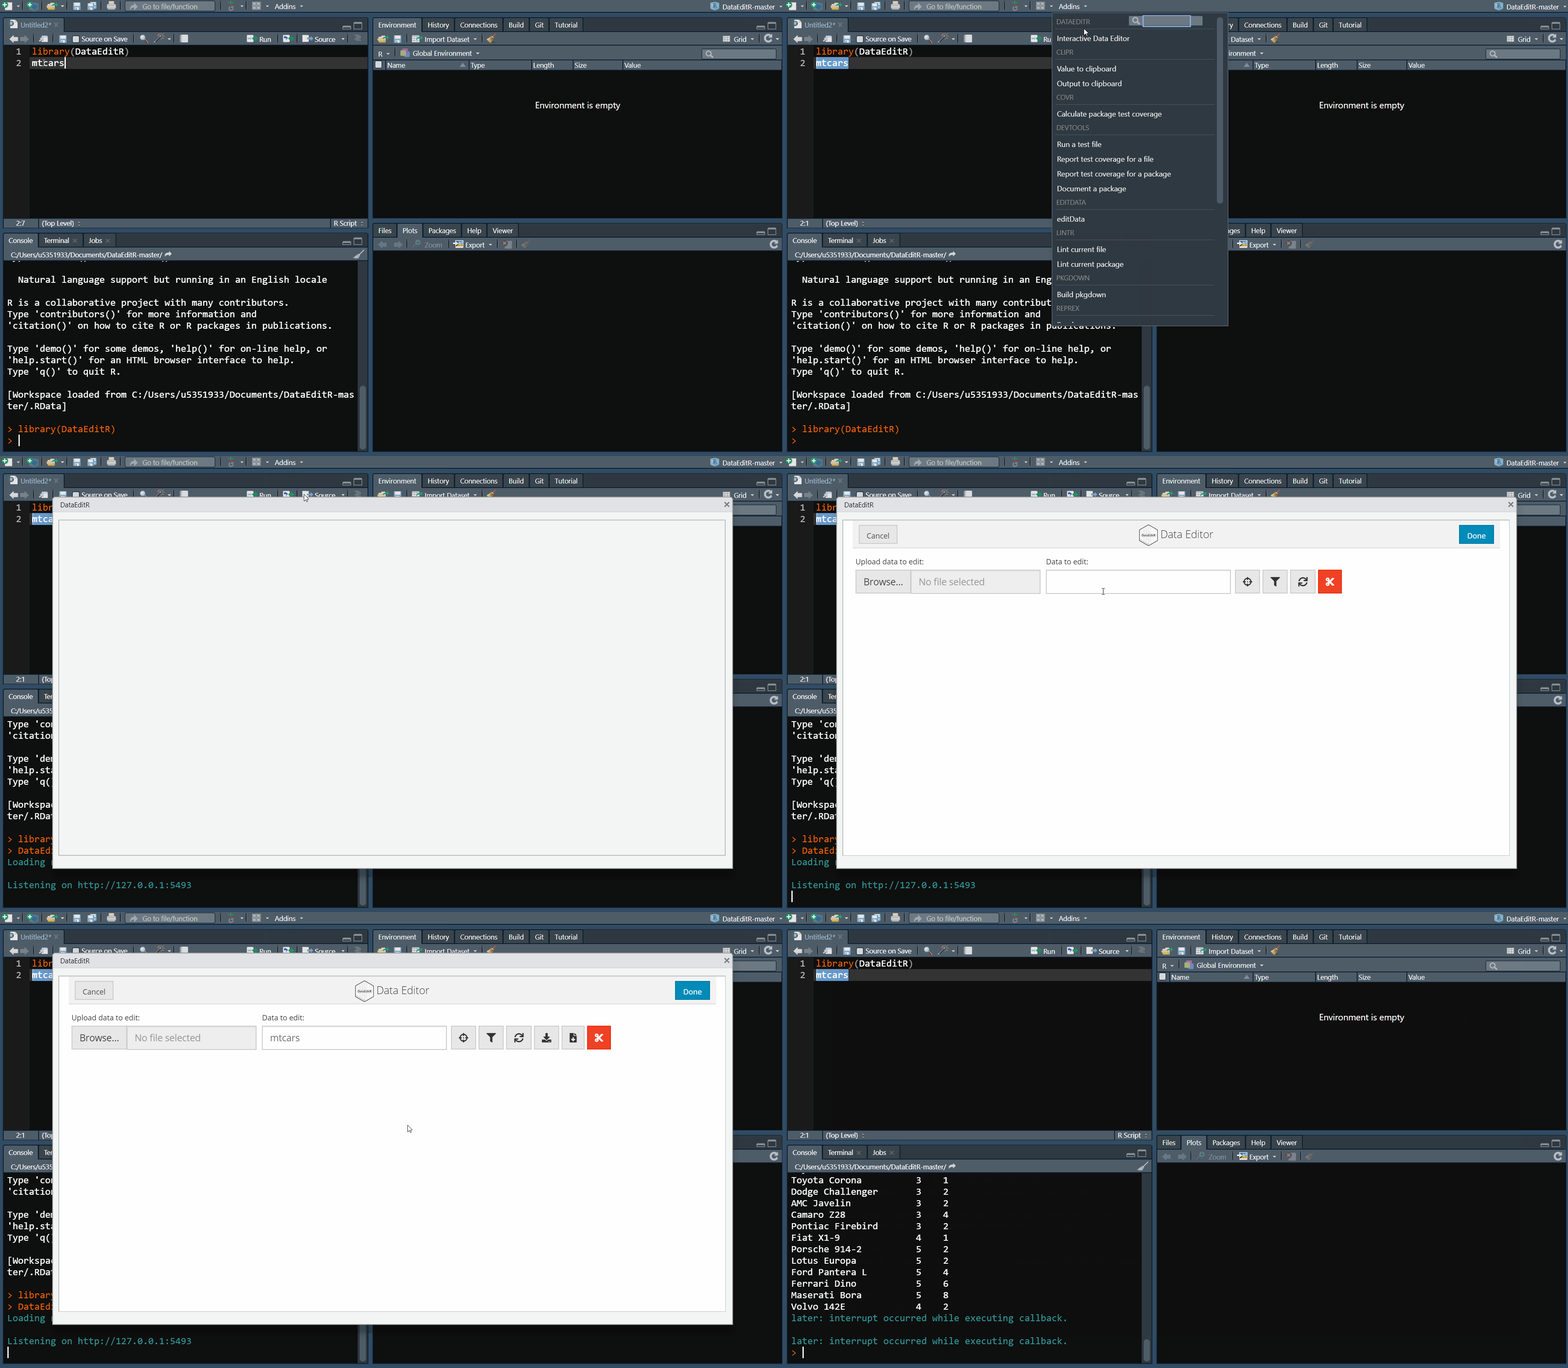
DataEditR also ships with an RStudio add-in should you prefer to interact with your data in this way. Simply highlight the name of a dataset in an active script and select the Interactive Data Editor from the list of Addins in your RStudio session.
For reproducibility, it is possible to export the code required to generate the final edited version of your data. Simply set code = TRUE within data_edit() to print this code to the console. Copying and pasting this code into the console will recreate the edited version of your data.
data_edit(mtcars,
    code = TRUE)
Alternatively, users can get DataEditR to automatically create a new R script to store this code by providing a name for the R script to code. For example, the below code creates a new R script called mtcars_edit.R and inserts the code required to programmatically generate the final edited version of your data.
data_edit(mtcars,
    code = "mtcars_edit.R")
DataEditR is a lightweight, powerful and intuitive package to allow interactive viewing, entry, filtering and editing of data in R. DataEditR also ships with separate shiny modules (namely dataInput, dataSelect, dataFilter, dataEdit and dataOutput) that can be used by developers in their own shiny applications.